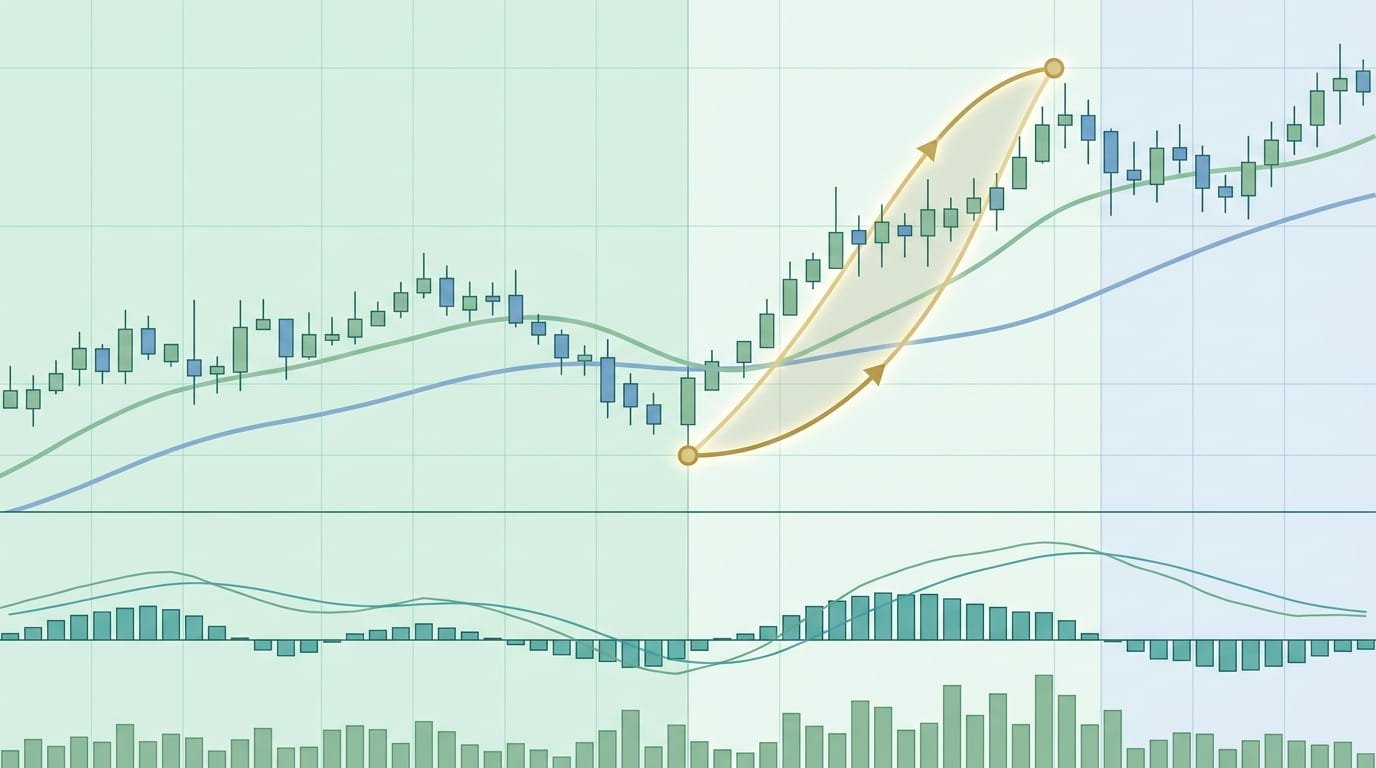
Top Indicators for Swing Trading Crypto
Swing trading crypto sits in the middle ground between day trading and long-term holding. You're not chasing five-minute candles, and you're not riding through 80% drawdowns either. You're trying to capture moves that play out over several days to a few weeks. That requires a different toolkit — one built around medium-term momentum, trend confirmation, and the price levels where serious volume has changed hands.
This guide covers four indicators worth knowing well: RSI, MACD, Volume Profile Visible Range, and Fibonacci retracement. More importantly, it covers how to combine them, the mistakes that quietly ruin swing trades, and a realistic look at the tools traders actually use to run this kind of analysis.
Foundational Indicators: Momentum and Trend
Every swing trader needs a way to measure two things: how strong the current move is, and which direction the broader trend is heading. RSI and MACD answer those two questions respectively, which is why they show up in nearly every trading system that has ever worked for anyone.
Relative Strength Index (RSI)
RSI is a momentum oscillator that moves between 0 and 100, measuring the speed and magnitude of recent price changes. Two things make it useful for swing traders:
Overbought and oversold zones. The standard reading is that RSI above 70 flags an overbought asset and below 30 flags an oversold one. These aren't signals on their own — they're zones of interest. In a strong uptrend, RSI can stay above 70 for weeks. Shorting Bitcoin every time daily RSI tagged 75 during a bull run would have been a quick way to get liquidated. Treat these levels as "pay attention here," not "trade now."
Divergence. This is where RSI genuinely earns its place. Bullish divergence is when price prints a lower low but RSI prints a higher low — bearish momentum is fading even though price is still making new lows. Bearish divergence is the mirror: higher high in price, lower high in RSI, suggesting the rally is running out of fuel. Spotting these on the 4-hour and daily charts gives you a heads-up before the crowd.
Moving Average Convergence Divergence (MACD)
MACD is derived from two exponential moving averages, which makes it a lagging indicator by design. It confirms what has already started to happen rather than predicting what will. That's a feature, not a bug — it keeps you from jumping at every wiggle.
The crossover. When the MACD line crosses above the signal line, momentum has turned bullish. When it crosses below, bearish. On higher timeframes, these crossovers mark meaningful shifts. On a 15-minute crypto chart, they're noise — don't bother.
The histogram. The bars show the distance between the MACD line and the signal line. Growing bars mean momentum is accelerating; shrinking bars mean it's cooling. The histogram often turns before the lines themselves cross, which gives attentive traders a small head start on the shift.
Volume and Price-Level Indicators
Momentum indicators tell you about speed and direction. They don't tell you where the market has fought its biggest battles. Volume-based tools fill that gap by mapping the price levels where real capital has changed hands.
Volume Profile Visible Range (VPVR)
Standard volume indicators plot volume against time. VPVR plots volume against price, drawing a horizontal histogram that shows exactly which price levels have seen the most trading activity.
Point of Control (POC). The single price level with the highest traded volume — the longest bar on the profile. Price tends to gravitate back to the POC, which is why it so often acts as strong support or resistance.
Value Area. The range (usually covering 70% of total volume) where most trading occurred. Prices inside are "fair value"; prices outside are stretched. High Volume Nodes within the value area act as sticky support and resistance, while Low Volume Nodes are price vacuums — markets tend to whoosh through them quickly because there's nothing to absorb orders.
One caveat crypto traders often miss: VPVR data is exchange-specific. A Binance profile will look different from a Coinbase profile because they have different liquidity. For major pairs, check the profile on the venue where the asset actually trades most.
Fibonacci Retracement
Fibonacci retracement is based on the observation that after a significant move, price tends to pull back a predictable fraction of that move before continuing. You draw the tool from a swing low to a swing high (or vice versa), and the platform plots horizontal lines at key ratios.
The levels that actually matter in practice:
0.382 (38.2%) — shallow pullback, common in strong trends
0.50 (50%) — the psychological halfway point, not technically a Fib ratio but widely watched
0.618 (61.8%) — the Golden Ratio, the deepest retracement that typically still preserves the trend
In an uptrend, swing traders watch these levels for buy zones during pullbacks. The 0.618 is often the highest-probability entry — if price breaks below it cleanly, the trend thesis is probably wrong. The catch is that Fibonacci levels only mean anything if you've drawn them from the right swing points, which is harder than it sounds.
Combining Indicators for Higher-Probability Setups
No single indicator is reliable enough to trade on its own. The point of using multiple tools isn't to find more signals — it's to find fewer, better ones. When two or three non-correlated indicators agree, you've got confluence, and confluence tends to filter out a meaningful share of false signals.
RSI + MACD: Confirming a Momentum Shift
A common confluence setup for a bullish swing entry:
Identify the setup. The asset is in a broader uptrend on the daily chart but has pulled back. Daily RSI drops below 30. This is an alert, not an entry.
Wait for the shift. RSI climbs back above 30, suggesting oversold pressure is releasing.
Confirm with MACD. Enter only after the MACD line crosses bullishly above the signal line, ideally with a rising histogram.
The MACD confirmation is what keeps you out of falling-knife trades. Oversold assets can stay oversold for a long time. Waiting for momentum to actually turn costs you a few percent off the bottom but saves you from catching trends that never reverse.
VPVR + Fibonacci: Validating a Support Zone
Fibonacci levels can feel arbitrary on their own — they're just ratios plotted on a chart. They become much more meaningful when they align with real volume.
Suppose Bitcoin rips from $60k to $75k and starts to pull back. You draw Fib levels across the move. The 0.618 retracement sits around $65.7k — and when you pull up VPVR, there's a High Volume Node right at $65.5–$66k from weeks of prior consolidation. That's a zone worth paying attention to. It's not just a mathematical ratio; it's a price where significant capital has already been committed. If price reaches that zone and shows signs of rejection (bullish divergence on RSI, a decisive rejection candle), you've got a setup with multiple reasons to be long rather than one.
Common Mistakes Swing Traders Make With These Indicators
Knowing what an indicator measures and knowing how to trade it are different skills. These are the pitfalls that show up most often in swing traders' journals.
Fading RSI in a strong trend. This is the classic mistake. A coin rips 40% in two weeks and daily RSI reads 82. You short it because "that's overbought." It goes to 90, then 95. In trending markets, overbought stays overbought and oversold stays oversold. RSI mean-reversion signals work best in ranging markets. In trends, use RSI divergence instead.
Using MACD on low timeframes. MACD is a lagging indicator built from moving averages. On a 15-minute crypto chart, by the time the crossover prints, the move is often already three-quarters done. If you're swing trading, the 4-hour and daily are the right timeframes. Leave the 5-minute MACD to day traders, and even they should be skeptical.
Drawing Fib levels from the wrong swing points. Fibs are only as good as the swings you anchor them to. Using an obvious liquidity wick as your swing high — or ignoring the true low because it happened in a thin-volume weekend session — produces levels that don't hold. Anchor to clear structural highs and lows where you can see real volume and a clean rejection.
Treating single-exchange VPVR as universal truth. Crypto liquidity is fragmented. A VPVR on Binance is telling you what happened on Binance. For BTC and ETH that's usually fine — most volume concentrates there. For mid- and small-cap alts that trade heavily on DEXs or on specific CEXs, check multiple venues before treating a High Volume Node as meaningful.
Cluttering the chart. Four indicators measuring different things (momentum, trend, volume, volatility) is plenty. Stacking RSI, Stochastic, Williams %R, and CCI just gives you four variations of the same momentum reading and four chances to talk yourself into a trade.
Choosing Your Charting Setup
The indicators in this guide are available on most charting platforms, but the specifics matter — particularly for VPVR and multi-chart layouts, which are often paywalled. Here's an honest look at what traders actually use.
TradingView is the default for a reason. The free tier covers RSI, MACD, and Fibonacci retracement without restrictions. VPVR, multiple charts per tab, and custom alerts live on paid plans, which run roughly $15 to $60 per month depending on tier. Best for: traders who want the deepest indicator library and the largest community of shared scripts.
TrendSpider ($39–$107/month) leans into automation — automated trendline detection, multi-timeframe analysis, and alert conditions that would require Pine Script knowledge on TradingView. Best for: traders who want to spend less time drawing and more time screening.
thinkorswim (free with a Charles Schwab account) is traditionally a stocks and options platform, but it now supports crypto charting through partner feeds. Best for: traders who trade both equities and crypto and want one charting environment for both.
SimpleMarkets.io is a newer entrant that consolidates crypto, stocks, forex, and prediction markets into a single dashboard with multi-condition alerts across asset classes. It's priced higher than free TradingView and has a smaller community of shared studies, but the cross-asset correlation view is something the crypto-native platforms don't replicate. Best for: traders who actively trade multiple asset classes and want one place to watch all of them.
Most serious swing traders end up using two tools: one for charting and analysis, and one for alerts and execution. Pick based on what you actually trade, not what's most popular on Twitter.
FAQ
What is the most accurate indicator for crypto swing trading?
There isn't one. The idea of a single "most accurate" indicator is a marketing myth. Reliability comes from confluence — two or three non-correlated tools agreeing. Pair a momentum oscillator (RSI), a trend-following indicator (MACD), and a volume-based tool (VPVR) and you'll filter out a large share of the false signals that crypto markets generate. Each indicator confirms the others; none is strong enough to trust alone.
How many indicators should a crypto swing trader use at once?
Two to four indicators that measure different things — momentum, trend, volume, volatility. Stacking five momentum oscillators just gives you five slightly different versions of the same information. The goal isn't to find an indicator that agrees with your bias; it's to find a clean setup where a few genuinely different tools point the same direction.
Which timeframe is best for swing trading crypto?
Swing trades typically last several days to a few weeks, so the 4-hour, 12-hour, and daily charts are where the signal lives. These timeframes filter out the intraday chop that makes crypto so brutal for day traders. You can use the 1-hour chart to fine-tune an entry or exit, but the trade thesis should originate from the higher timeframes.
Can I automate a strategy based on these indicators?
Yes, with different levels of effort. The most common paths:
TradingView alerts → webhook → exchange API. Set an alert on your indicator condition, fire a webhook to a service like 3Commas, Cryptohopper, or your own server, which then executes the trade. This is how most retail automation works.
Dedicated platforms like 3Commas or Coinrule let you build rule-based bots without code. Less flexibility than custom webhooks, but faster to set up.
Pine Script or Python with a broker API for traders comfortable coding. This gives you full control but requires serious backtesting before you risk live capital (SimpleMarkets' no-code backtester covers crypto, stocks, and forex).
Whatever the path, backtest thoroughly and size small while you're validating. Most automated strategies fail not because the indicators don't work, but because slippage, fees, and edge-case behavior eat the profit in live trading.
Do I need a paid tool to use these indicators?
Not for the basics. RSI, MACD, and Fibonacci retracement are available free on TradingView's free tier, on most exchange-native charts (Coinbase Advanced, Binance, Kraken), and on free desktop platforms. Where the paywall hits is VPVR, multi-chart layouts, custom multi-condition alerts, and data exports — TradingView paid tiers start around $15/month, and platforms like TrendSpider cost more. Whether that's worth it depends on how much time the efficiency actually saves you. A trader taking one or two positions a week probably doesn't need to pay; a trader running twenty symbols across multiple timeframes probably does.
If you want to test the confluence approach across crypto, stocks, and forex from a single dashboard, SimpleMarkets.io offers multi-asset charting with cross-market alerts. Try it alongside your current setup and see whether the consolidation is worth it for your workflow. For which indicator systems survived honest testing, see the public research log.