Multi-Market Trading Dashboards in 2026:
What They Actually Do, What They Cost, and Whether You Need One
SimpleMarkets Blog
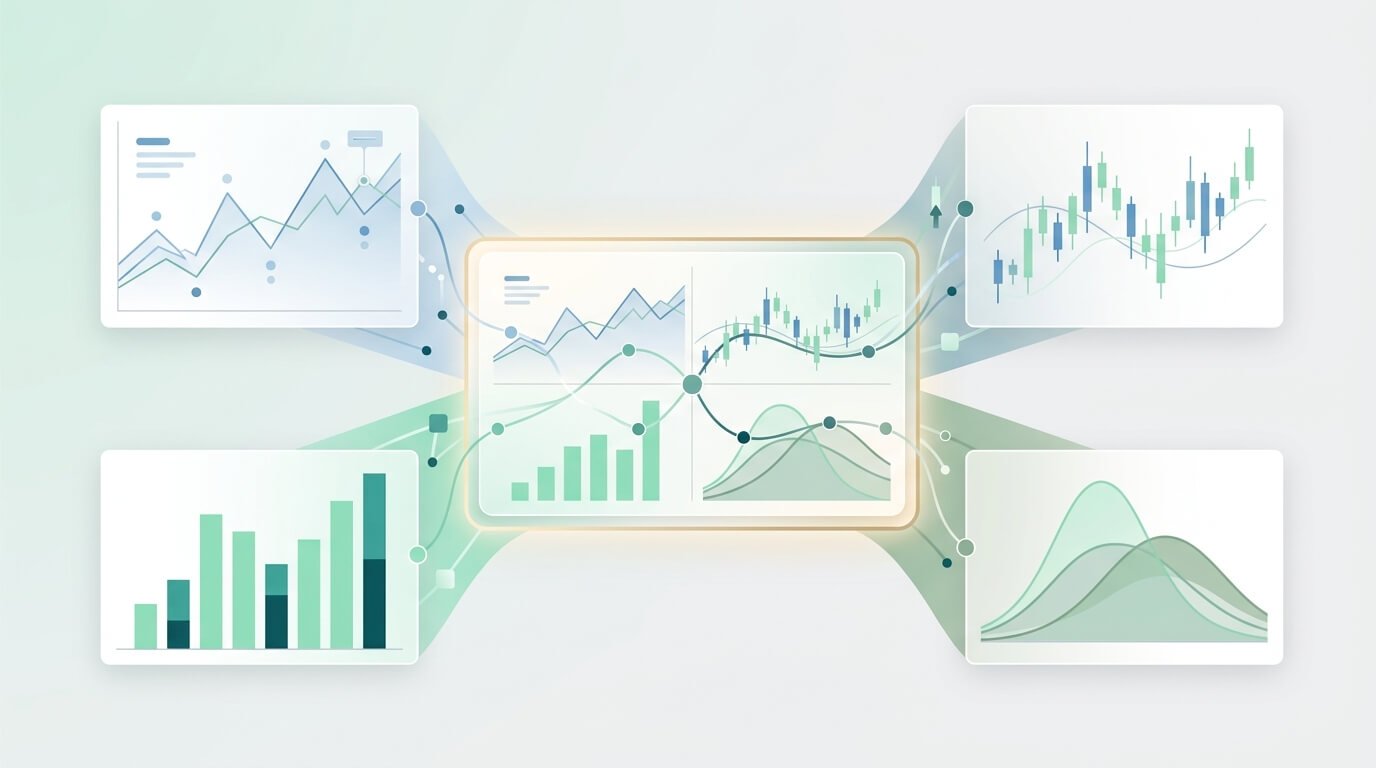
If you trade across more than two asset classes, you already know the problem. Your crypto is on one exchange, your stocks on a brokerage, your forex positions on a third platform. Each gives you a clean view of what it holds—and zero visibility into how those positions relate to each other. A multi-market trading dashboard is the tool that closes that gap. It connects to your existing accounts via API and pulls everything into a single interface for monitoring, analysis, and (in many cases) execution.
This guide covers what these dashboards actually do, where they fall short, what they cost, and how to evaluate whether one is worth the subscription for your specific situation.
What a Multi-Market Dashboard Does (and Doesn’t Do)
A dashboard sits on top of your existing accounts. It doesn’t custody your assets or replace your broker. Instead, it reads data from your connected accounts and presents it in a unified view. The better platforms also let you execute trades through those connections, so you can act on what you see without switching windows.
The core value proposition is consolidation. Rather than logging into Coinbase, then Schwab, then MetaTrader, then your sportsbook, you open one interface that shows your total capital allocation, your aggregate P&L, and your exposure across asset classes.
What it does well
• Aggregates positions and performance data from multiple platforms into a single portfolio view
• Enables cross-market analysis (overlaying BTC against the S&P 500, correlating oil with CAD, etc.)
• Provides a top-down view of total risk exposure that no single-platform account screen can offer
• Reduces context-switching by centralizing charting, alerts, and order execution
What it doesn’t do
• It won’t make you a better trader. If your thesis is wrong, seeing it on a prettier screen doesn’t help.
• It doesn’t custody assets or provide better execution than your underlying broker/exchange.
• Integration quality varies. A dashboard is only as good as its API connections, and some can lag or break during high-volatility periods when you need them most.
Core Features Worth Paying For
There are dozens of platforms in this space, ranging from free portfolio trackers to professional-grade terminals. Here’s what actually matters when you’re comparing them.
Unified Portfolio View
The baseline. If a dashboard can’t connect to all your accounts and display them together, nothing else matters. This means real-time (or near-real-time) position data, performance tracking, and allocation breakdowns across every asset class you trade.
Cross-Market Charting and Correlation Tools
This is where dashboards earn their keep. The ability to overlay price charts from different asset classes on a single screen, run correlation analysis, or set alerts based on cross-market conditions is genuinely difficult to replicate with free tools. If you’re trading macro themes—say, watching how dollar strength affects your commodity positions and your EM equity exposure simultaneously—this feature alone can justify the subscription.
Integrated Execution
A view-only dashboard is useful for monitoring, but the real time savings come from platforms that let you execute trades directly. You identify a setup on the chart, and the order panel is right there—no switching to another tab, no re-entering the ticker. The execution quality still depends on your underlying broker, but eliminating the switching friction matters more than most people expect.
Customizable Layouts and Alerts
Professional charting (often TradingView-powered), customizable workspace layouts, and cross-market alerting. These features exist individually in free tools, but the value of a paid dashboard is having them work together across all your connected accounts.
The Three Real Benefits (Stated Honestly)
1. Time efficiency
This one is straightforward and measurable. If you currently spend 20 minutes a day logging into different platforms, reviewing positions, and switching between charting tools, a consolidated dashboard cuts that to 5. Over a month, that’s roughly 8 hours back. Whether that time is worth $50–200/month depends on what you do with it.
2. Risk visibility
This is the benefit most traders undervalue. When your positions are siloed, you can’t easily answer the question: “How much of my total capital is exposed to risk-on sentiment right now?” You might own DeFi tokens and high-growth tech stocks and think you’re diversified across asset classes. A dashboard that shows your aggregate exposure reveals that you’re actually running a concentrated bet on the same macro factor. This visibility doesn’t guarantee better decisions, but it makes willful ignorance harder.
3. Cross-market pattern recognition
Markets are interconnected. Dollar strength ripples through commodities, which affect mining stocks, which influence sector ETFs. A unified dashboard makes these relationships visible in real time. The caveat: spotting a correlation on a chart and profitably trading it are two very different things. The dashboard shows you the relationship; your skill and discipline determine whether you can exploit it.
Who Actually Needs One (and Who Doesn’t)
You probably need one if:
• You actively trade across 3+ platforms and the context-switching is genuinely costing you time or causing errors
• You trade macro themes where cross-asset correlations directly inform your decisions
• Your portfolio is large enough that a $50–200/month tool is a rounding error on your total capital
You probably don’t need one if:
• You’re a buy-and-hold investor who checks positions quarterly. A free portfolio tracker is fine.
• You only trade one asset class. Your existing platform already gives you everything you need.
• Your total portfolio is under $10k. The subscription cost likely exceeds the marginal value.
A Note on Sports Betting and Prediction Markets
Some dashboards—including ours—integrate sports betting and prediction market data alongside traditional financial assets. This deserves an honest discussion.
The functional argument is simple: if you’re allocating capital to DraftKings or a prediction market alongside your stock and crypto portfolios, it makes sense to see that capital in the same consolidated view. Money is money, and tracking your total allocation is better than not tracking it.
The important caveat: sports bets and prediction markets carry fundamentally different risk characteristics than financial instruments. They have binary outcomes, fixed time horizons, and (in the case of sports betting) a built-in house edge. Treating a parlay the same way you treat a stock position in your mental accounting is a mistake, even if they appear on the same dashboard. A good dashboard will display them, but a good trader will understand the distinction.
We include these integrations because many of our users allocate capital across all of these categories. But we’d rather be upfront about the limitations than pretend that putting sports bets on the same screen as equities makes them equivalent investments.
How to Evaluate a Platform
Start with your integration list
Before you look at features or pricing, make a list of every account you want connected: exchanges, brokers, sportsbooks, everything. Then check whether the platform you’re evaluating actually supports stable API connections to each one. A dashboard that covers 90% of your accounts is useful; one that covers 60% with flashy features is not.
Check the security model
You’re granting API access to your financial accounts. Non-negotiable requirements: two-factor authentication, encrypted API key storage, and—critically—the platform should never require withdrawal permissions on your API keys. If a dashboard asks for withdrawal access, walk away.
Understand the real cost
Most professional-grade dashboards charge $50–200/month. That’s a real expense, and framing it as an “investment that pays for itself” is the kind of thing every SaaS company says. Here’s a more honest framework: calculate how many hours per month the tool saves you, multiply by what your time is worth, and compare that to the subscription. If the math doesn’t work, the tool isn’t for you yet—and that’s fine.
Platform comparison at a glance
This is a simplified comparison. Feature sets change frequently, so verify directly with each platform before committing.
TradingView
Stocks + Crypto: Charting only | Forex: Charting only | Sports / Alt: No | Price: $0–$60/mo
Best for: Pure charting and technical analysis across traditional assets. Not a portfolio aggregator—it doesn’t connect to your accounts or track positions.
Coinigy / Atani
Stocks + Crypto: Crypto focused | Forex: Limited | Sports / Alt: No | Price: $20–$100/mo
Best for: Crypto-first traders who need multi-exchange connectivity and execution. Strong if crypto is your primary asset class.
SimpleMarkets
Stocks + Crypto: Yes | Forex: Yes | Sports / Alt: Yes | Price: See site
Best for: Traders who operate across traditional finance, crypto, and alternative markets. Widest asset coverage; newer platform with a smaller track record.
Feature sets change frequently. Verify directly with each platform before committing.
Where SimpleMarkets Fits
We built SimpleMarkets to solve this problem for traders who operate across traditional finance, crypto, and alternative markets like sports betting and prediction markets. That breadth of coverage is our differentiator—most platforms stop at stocks and crypto.
That said, if you only trade stocks, TradingView or your broker’s built-in tools are probably sufficient. If you’re crypto-only, Coinigy or Atani may be a better fit. We’re the right choice for traders whose activity genuinely spans multiple market categories and who want all of that in one interface.
If that sounds like you, check out our current plans at simplemarkets.io.
FAQ
Are trading dashboards worth the subscription?
For active multi-market traders, usually yes. The value is primarily in time savings and risk visibility. If you’re a passive investor who checks in quarterly, the monthly fee doesn’t make sense. A reasonable test: if you’re logging into 3+ platforms daily to manage positions, a dashboard will meaningfully reduce that friction.
Can I trade stocks and crypto on the same platform?
Some brokerages (like Robinhood) offer both, but with limited crypto selection and execution options. A multi-market dashboard takes a different approach: it connects to your dedicated crypto exchange and your stockbroker, giving you a unified interface on top of specialized execution venues. You get one screen without sacrificing the liquidity or features of purpose-built platforms.
How secure is connecting accounts via API?
When done correctly, quite secure. You connect via API keys, not login credentials. The critical step: always create keys with trade permissions only and withdrawal permissions disabled. This means the dashboard can read your data and place trades, but can never move funds. Choose platforms that require 2FA and have transparent security documentation.
Is mobile access available?
It varies by platform. Many professional-grade dashboards are web-based or desktop-first because the complexity of multi-asset charting and execution requires real screen space. SimpleMarkets is currently web-based without a native mobile app. If mobile access is a priority, verify this before subscribing to any platform.
What’s the best all-in-one trading platform?
There isn’t one. The right tool depends entirely on what you trade. For charting traditional assets, TradingView is hard to beat. For crypto-focused trading, Coinigy and Atani are strong. For traders who span stocks, crypto, and forex, SimpleMarkets is built for that specific use case. Define your non-negotiable integrations first, then evaluate. Start free — no card required.